The graph in the figure shows the tensile stress as a function of the tensile strain in a certain wire. What does the slope of this graph give us for this wire? 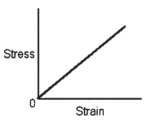
A) the pressure in the wire
B) Young's modulus for the material of the wire
C) the tensile stress in the wire
D) the tension in the wire
E) the percent change in the length of the wire
Correct Answer:
Verified
Q5: Which of the following are SI units
Q5: When a car is weighed,it is driven
Q9: If the sum of the external torques
Q14: Two wires are made out of the
Q17: A 25-kg piece of equipment can be
Q21: A uniform ladder 12 meters long rests
Q22: An irregularly shaped object that is
Q24: A uniform 1200-N piece of medical apparatus
Q26: A 15-kg child is sitting on a
Q91: An ornament of mass 40.0 g is
Unlock this Answer For Free Now!
View this answer and more for free by performing one of the following actions

Scan the QR code to install the App and get 2 free unlocks

Unlock quizzes for free by uploading documents