For the graph shown in the figure, what physical quantity does the slope of the graph represent for ohmic material? 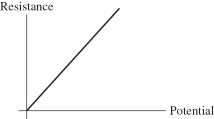
A) current
B) resistivity
C) 1/(current)
D) power
E) 1/(resistivity)
Correct Answer:
Verified
Q1: If a quantity you calculated has units
Q4: You are given a copper bar of
Q9: For the graph shown in the figure,
Q9: If a quantity you calculated has units
Q11: The figure shows electrons passing through a
Q17: Copper wire #1 has a length L
Q17: For the graph shown in the figure,
Q18: The length of a certain wire is
Q18: For the graph shown in the figure,
Q19: The figure shows a graph of the
Unlock this Answer For Free Now!
View this answer and more for free by performing one of the following actions

Scan the QR code to install the App and get 2 free unlocks

Unlock quizzes for free by uploading documents