Examine these two graphs and based on the demand pattern and axis scaling, recommend a forecasting technique (and the required parameters)that would work best for each one. Justify your recommendations. 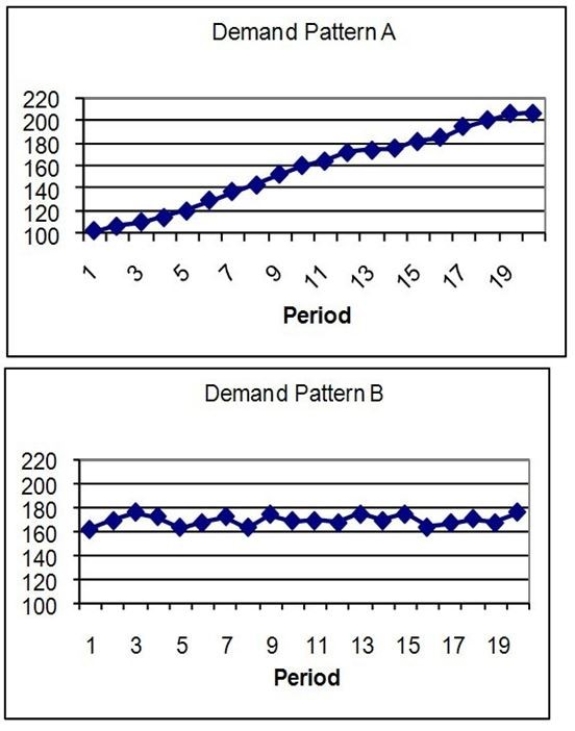
Correct Answer:
Verified
View Answer
Unlock this answer now
Get Access to more Verified Answers free of charge
Q21: Two time series techniques that are appropriate
Q22: Consider the data that generate this plot
Q23: Fluctuations in demand due to seasonality are
Q24: Exponential smoothing with an alpha of one
Q25: A(n)_ forecasting model bases all forecasts on
Q27: The greater the randomness in the data,
Q28: The slope of the regression equation is
Q29: When there is a significant upward or
Q30: A seasonal pattern in time series data
Q31: A seasonal index less than 1.0 means
Unlock this Answer For Free Now!
View this answer and more for free by performing one of the following actions

Scan the QR code to install the App and get 2 free unlocks

Unlock quizzes for free by uploading documents