Figure 2.2
The histogram below represents scores achieved by 200 job applicants on a personality profile. 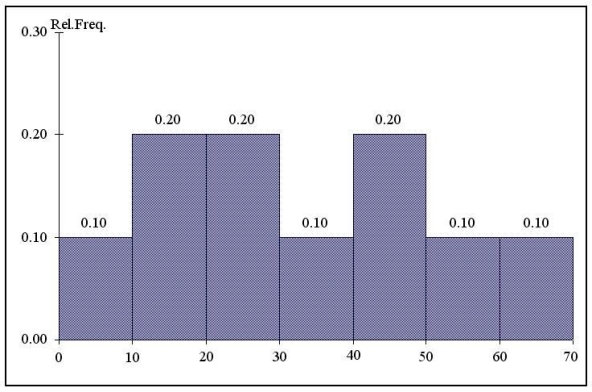
-Referring to the histogram from Figure 2.2,90% of the job applicants scored above or equal to _________.
Correct Answer:
Verified
Q88: Figure 2.2
The histogram below represents scores achieved
Q89: In order to compare one large batch
Q90: Instruction 2.6
The frequency distribution below represents
Q91: The point halfway between the boundaries of
Q92: Instruction 2.6
The frequency distribution below represents
Q94: When comparing two or more large batches
Q95: It is essential that each class grouping
Q96: A _ is a vertical bar chart
Q97: Instruction 2.6
The frequency distribution below represents
Q98: Instruction 2.6
The frequency distribution below represents
Unlock this Answer For Free Now!
View this answer and more for free by performing one of the following actions

Scan the QR code to install the App and get 2 free unlocks

Unlock quizzes for free by uploading documents