The following diagram shows the investment opportunity set for portfolios containing stocks A and B.You need to know that:
•Point A on the graph represents a portfolio with 100% in stock A
•Point B represents a portfolio with 100% in stock B 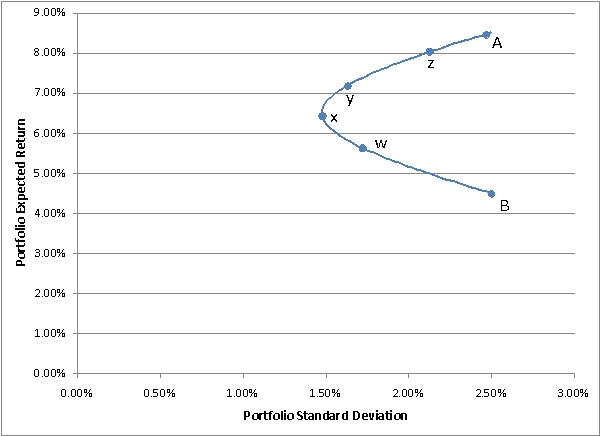 a.Is the correlation between A and B greater than,equal to,or less than 1.How do you know?
b.Which labeled point on the graph represents the minimum variance portfolio?
c.Which labeled point on the graph represents a portfolio with 88% invested in stock A and the rest in B?
d.If A and B are the only investments available to an investor,which of the labeled portfolios are efficient?
e.Suppose a risk-free asset exists,allowing an investor to invest or borrow at the risk-free rate of 3%.If the above graph is drawn perfectly to scale,which labeled point represents the optimal risky portfolio.
f.Under the assumptions in part (e),would it be wise for an investor to invest all of his or her money in stock A? Why or why not?
Correct Answer:
Verified
View Answer
Unlock this answer now
Get Access to more Verified Answers free of charge
Q15: The annual returns of Wonder Widgets,Inc.and
Q16: Stock A has an expected return
Q17: Consider the following data for assets
Q18: What is the concept behind the indexes
Q19: An efficient frontier is:
A) a combination of
Q21: Discuss how betas are obtained and some
Q22: Discuss the economic properties of utility functions.
Q23: Explain how the equity premium work in
Q24: What is a stock's own variance and
Q25: A security analyst works for a
Unlock this Answer For Free Now!
View this answer and more for free by performing one of the following actions

Scan the QR code to install the App and get 2 free unlocks

Unlock quizzes for free by uploading documents