A graph of the force on an object as a function of its position is shown in the figure.Determine the amount of work done by this force on an object that moves from  to
to  .(Assume an accuracy of 2 significant figures for the numbers on the graph.)
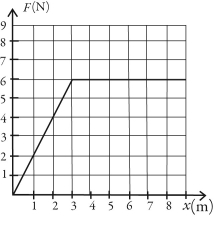
A) 26 J
B) 29 J
C) 22 J
D) 35 J
E) 27 J
Correct Answer:
Verified
Q13: Find the net work done by friction
Q14: In the figure,a constant external force P
Q15: In the figure,a 700-kg crate is on
Q16: Two objects,one of mass m and the
Q17: If a force always acts perpendicular to
Q19: Consider a plot of the displacement (x)as
Q20: A stock person at the local grocery
Q21: A person pushes horizontally on a heavy
Q22: In the figure,two identical springs have unstretched
Q23: A constant horizontal pull acts on a
Unlock this Answer For Free Now!
View this answer and more for free by performing one of the following actions

Scan the QR code to install the App and get 2 free unlocks

Unlock quizzes for free by uploading documents