Figure 3.8 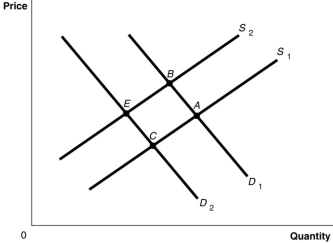
-Refer to Figure 3.8.The graph in this figure illustrates an initial competitive equilibrium in the market for apples at the intersection of D1 and S1 (point A) . If there is an increase in the wages of apple workers and an increase in the price of oranges, a substitute for apples, the equilibrium could move to which point?
A) None of the points shown
B) B
C) C
D) E
Correct Answer:
Verified
Q145: Which of the following would cause both
Q159: Olive oil producers want to sell more
Q165: Which of the following would cause an
Q184: Assume that both the demand curve and
Q185: Assume that the demand curve for MP3
Q195: Assume that the demand curve for MP3
Q196: Assume that both the demand curve and
Q212: Which of the following statements is true?
A)An
Q365: Figure 3-8 Q366: Figure 3-8 ![]()
![]()
Unlock this Answer For Free Now!
View this answer and more for free by performing one of the following actions

Scan the QR code to install the App and get 2 free unlocks

Unlock quizzes for free by uploading documents