Multiple Choice
Figure 6.5 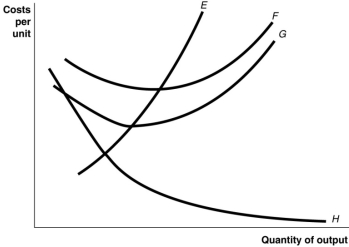
-Refer to Figure 6.5.Identify the curves in the diagram.
A) E = average fixed cost curve; F = variable cost curve; G = total cost curve; H = marginal cost curve
B) E = marginal cost curve; F = total cost curve; G = variable cost curve; H = average fixed cost curve
C) E = average fixed cost curve; F = average total cost curve; G = average variable cost curve; H = marginal cost curve
D) E = marginal cost curve; F = average total cost curve; G = average variable cost curve; H = average fixed cost curve
Correct Answer:
Verified
Related Questions
Q143: Marginal cost is calculated for a particular
Q151: The change in a firm's total cost

