Figure 6.11 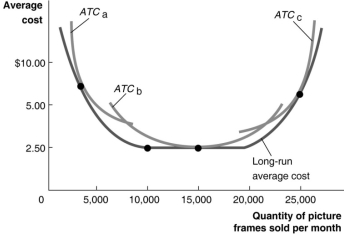 Figure 6.11 illustrates the long-run average cost curve for a firm that produces picture frames. The graph also includes short-run average cost curves for three firm sizes: ATCa, ATCb, and ATCc.
-Refer to Figure 6.11.At what rate of output is the minimum efficient scale of output reached?
A) 10 000 workers
B) 5 000 picture frames
C) 20 000 picture frames
D) 10 000 picture frames
Correct Answer:
Verified
Q205: Explain how the listed events (a-d)would affect
Q212: If production displays economies of scale, the
Q217: If, when a firm doubles all its
Q222: Table 6.8 Q222: Which of the following is not a
Unlock this Answer For Free Now!
View this answer and more for free by performing one of the following actions

Scan the QR code to install the App and get 2 free unlocks

Unlock quizzes for free by uploading documents