Multiple Choice
Figure 8.3 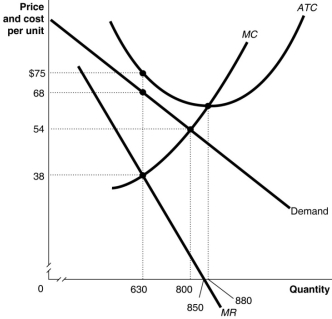 Figure 8.3 above shows the demand and cost curves facing a monopolist.
-Refer to Figure 8.3.What happens to the monopolist represented in the diagram in the long run?
A) It will raise its price at least until it breaks even.
B) If the cost and demand curves remain the same, it will exit the market.
C) The government will subsidise the monopoly to enable it to break even.
D) It will be forced out of business by more efficient producers.
Correct Answer:
Verified
Related Questions
Q81: Long-run economic profits would most likely exist
Q82: Figure 8.3 Q83: Figure 8.5 Q84: What do economists call firms that face![]()
![]()

