Multiple Choice
Figure 8.9 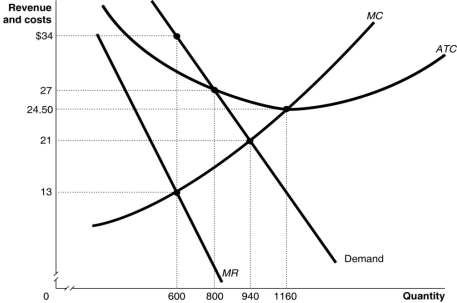 Figure 8.9 shows the demand and cost curves for a monopolist.
-Refer to Figure 8.9.The economically efficient output level is
A) 600 units
B) 800 units
C) 940 units
D) 1160 units
Correct Answer:
Verified
Related Questions
Q120: Figure 8.6 Q122: Figure 8.10 Q122: To what does market power refer? Q125: Explain whether a monopoly that maximises profit Unlock this Answer For Free Now! View this answer and more for free by performing one of the following actions Scan the QR code to install the App and get 2 free unlocks Unlock quizzes for free by uploading documents![]()
![]()
A)The ability

