Multiple Choice
Figure 8.9 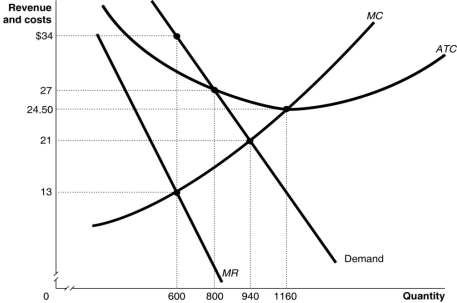 Figure 8.9 shows the demand and cost curves for a monopolist.
-Refer to Figure 8.9.At the profit-maximising quantity,the difference between the monopoly's price and the marginal cost of production is -.
A) $8
B) $11.50
C) $21
D) There is no difference.
Correct Answer:
Verified
Related Questions
Q122: To what does market power refer?
A)The ability
Q124: Economic efficiency in a free market occurs

