Figure 8.11 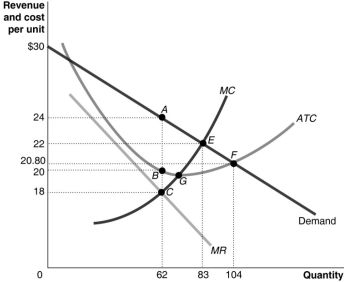 Figure 8.11 shows the cost and demand curves for a monopolist.
-Refer to Figure 8.11.Assume the firm maximises its profits.The amount of consumer surplus is -.
A) $21
B) $124
C) $186
D) $332
Correct Answer:
Verified
Q144: Suppose a monopoly is producing its profit-maximising
Q149: A profit-maximising monopoly produces a lower output
Q161: Figure 8.13 Q188: In evaluating the degree of economic efficiency Q195: In reality, because few markets are perfectly Q196: If a per-unit tax on output sold Q209: How do the price and quantity of Q218: Suppose that a perfectly competitive industry becomes Q225: Economic efficiency requires that a natural monopoly's Q262: A product's price approaches its marginal cost![]()
Unlock this Answer For Free Now!
View this answer and more for free by performing one of the following actions

Scan the QR code to install the App and get 2 free unlocks

Unlock quizzes for free by uploading documents