Multiple Choice
Figure 9.8 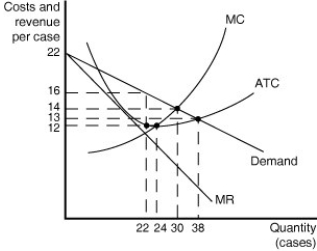 Figure 9.8 shows cost and demand curves for a monopolistically competitive producer of iced tea.
-Refer to Figure 9.8.Based on the diagram,one can conclude that _______.
A) some existing firms will exit the market
B) new firms will enter the market
C) the industry is in long-run equilibrium
D) firms achieve productive efficiency
Correct Answer:
Verified
Related Questions
Q88: A monopolistically competitive firm chooses
A)both the quantity
Q91: A monopolistically competitive firm maximises profit in
Q92: If a monopolistically competitive firm is producing

