Figure 9.11 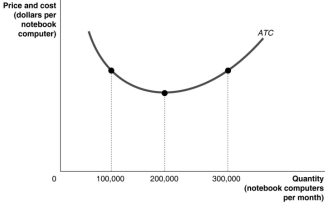
-Refer to Figure 9.11.Suppose the above graph represents the relationship between the average total cost of producing notebook computers and the quantity of notebook computers produced by Dell.On a graph,illustrate the demand,MR,MC,and ATC curves which would represent Dell maximising profits at a quantity of 100 000 per month and identify the area on the graph which represents the profit.
__________________________________________________________________________________________________________________________________________________________________________________________
Correct Answer:
Verified
Q104: A monopolistically competitive firm should lower its
Q106: Assume that price exceeds average variable cost
Q109: A profit-maximising monopolistically competitive firm produces and
Q111: For a profit-maximising monopolistically competitive firm, for
Unlock this Answer For Free Now!
View this answer and more for free by performing one of the following actions

Scan the QR code to install the App and get 2 free unlocks

Unlock quizzes for free by uploading documents