Multiple Choice
Figure 10.3 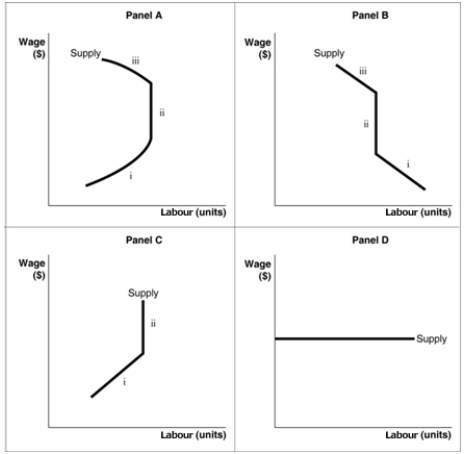
-Refer to Figure 10.3.The panel in the diagram which best represents an individual's labour supply curve is _________.
A) Panel A
B) Panel B
C) Panel C
D) Panel D
Correct Answer:
Verified
Related Questions
Q84: If Alan Shaw reduces his work hours
Q87: All of the following will shift the
Q88: When is the income effect of a
Q93: When is the substitution effect of a
Unlock this Answer For Free Now!
View this answer and more for free by performing one of the following actions

Scan the QR code to install the App and get 2 free unlocks

Unlock quizzes for free by uploading documents