Multiple Choice
Figure 11.8 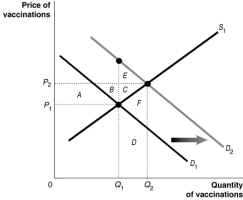 Figure 11.8 shows the market for measles vaccinations, a product whose use generates positive externalities.
-Refer to Figure 11.8.What does D2 represent?
A) The social welfare curve
B) The demand curve reflecting social benefit
C) The demand curve reflecting private benefit
D) The positive externalities curve
Correct Answer:
Verified
Related Questions
Q30: When does a free market fail?
A)When there
Q34: Which of the following would result in
Q42: When there is a positive externality,
A) the
Q43: When there is an externality in a
Q52: When production generates a negative externality, the
Q59: The social cost of cutting trees for
Q99: In economics, the optimal level of pollution

