Figure 12.1 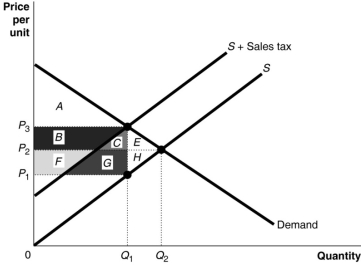
-Refer to Figure 12.1.Area B + C + F + G represents
A) the portion of sales tax revenue borne by consumers.
B) the portion of sales tax revenue borne by producers.
C) the excess burden of the sales tax.
D) sales tax revenue collected by the government.
Correct Answer:
Verified
Q52: Figure 12.1 Q58: Figure 12.1 Q131: If the marginal tax rate is greater Q133: Suppose the government wants to finance housing Q141: The actual division of the burden of Q147: Horizontal equity is achieved when taxes are Q152: If your income is $92,000 and you Q153: If you pay $14,000 in taxes on Q156: Exempting food purchases from sales tax is Q160: Suppose the government imposes an 8 percent![]()
![]()
Unlock this Answer For Free Now!
View this answer and more for free by performing one of the following actions

Scan the QR code to install the App and get 2 free unlocks

Unlock quizzes for free by uploading documents