A graph of the force on an object as a function of its position is shown in the figure. Determine the amount of work done by this force on the object during a displacement from x = -2.00 m to x = 2.00 m.(Assume an accuracy of 3 significant figures for the numbers on the graph.) 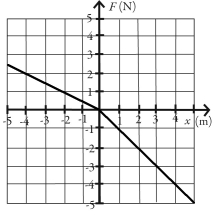
A) -12.0 J
B) -3.00 J
C) -1.00 J
D) 12.0 J
E) 3.00 J
Correct Answer:
Verified
Q23: A 1000 kg car experiences a net
Q30: A worker lifts a 20.0-kg bucket of
Q36: You slam on the brakes of your
Q39: A person pushes horizontally on a heavy
Q41: A 7.0-kg rock is subject to a
Q41: A mass is pressed against (but is
Q42: In the figure,a 5.00-kg block is moving
Q43: A child pulls on a wagon with
Q51: A 1500-kg car accelerates from 0 to
Q63: How long will it take a 7.08
Unlock this Answer For Free Now!
View this answer and more for free by performing one of the following actions

Scan the QR code to install the App and get 2 free unlocks

Unlock quizzes for free by uploading documents