A graph of the force on an object as a function of its position is shown in the figure. Determine the amount of work done by this force on an object that moves from x = 1.0 m to x = 6.0 m. (Assume an accuracy of 2 significant figures for the numbers on the graph.) 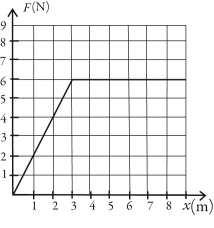
A) 26 J
B) 29 J
C) 22 J
D) 35 J
E) 27 J
Correct Answer:
Verified
Q3: A time-varying horizontal force F(t)= At4 +
Q10: Two stones,one of mass m and the
Q17: If a force always acts perpendicular to
Q217: A 6.00-kg block is in contact with
Q219: Three objects are connected by massless wires
Q220: In the figure,two identical ideal massless springs
Q221: Two objects,one of mass m and the
Q223: An object is acted upon by a
Q224: A box of mass m is pressed
Q227: A box of mass m is pressed
Unlock this Answer For Free Now!
View this answer and more for free by performing one of the following actions

Scan the QR code to install the App and get 2 free unlocks

Unlock quizzes for free by uploading documents