A graph of the force on an object as a function of its position is shown in the figure. Determine the amount of work done by this force on the object during a displacement from x = -2.00 m to x = 2.00 m.(Assume an accuracy of 3 significant figures for the numbers on the graph.) 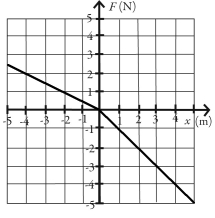
A) -12.0 J
B) -3.00 J
C) -1.00 J
D) 12.0 J
E) 3.00 J
Correct Answer:
Verified
Q2: Two men,Joel and Jerry,push against a wall.Jerry
Q2: You carry a 7.0 kg bag of
Q5: A ball drops some distance and gains
Q10: Two stones,one of mass m and the
Q17: If a force always acts perpendicular to
Q23: A crane lifts a 425 kg steel
Q223: An object is acted upon by a
Q224: A box of mass m is pressed
Q227: A box of mass m is pressed
Q229: A box of mass m is pressed
Unlock this Answer For Free Now!
View this answer and more for free by performing one of the following actions

Scan the QR code to install the App and get 2 free unlocks

Unlock quizzes for free by uploading documents