The figure shows a graph of the resistance of a wire as a function of its length.What physical quantities does the slope of this graph represent? 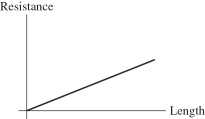
A) the cross-sectional area of the wire
B) the resistivity of the material of which the wire is made
C) the product of the resistivity and the cross-sectional area of the wire
D) the resistivity of the material divided by the cross-sectional area of the wire
E) the reciprocal of the resistivity of the material
Correct Answer:
Verified
Q4: You are given a copper bar of
Q9: If a quantity you calculated has units
Q10: You are given a copper bar of
Q11: When there is electric current through a
Q12: For the graph shown in the figure,what
Q13: The length of a certain wire is
Q15: The length of a certain wire is
Q18: The length of a certain wire is
Q18: The figure shows conventional current through a
Q20: The length of a certain wire is
Unlock this Answer For Free Now!
View this answer and more for free by performing one of the following actions

Scan the QR code to install the App and get 2 free unlocks

Unlock quizzes for free by uploading documents