The graph shown in the figure shows the results of measurements of the dc current through a circuit device for various potential differences across it.Assume that all the numbers shown are accurate to two significant figures.What is the resistance of this device? 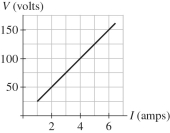
Correct Answer:
Verified
Q69: A 25-m wire of diameter 0.30 mm
Q83: A 1.0-m length of nichrome wire has
Q86: When a 1.0-m length of metal
Q89: The resistance of a 100-cm wire
Q89: Calculate the current through a 10.0-m long
Q92: How much current will be flowing
Q93: A metal bar is 20 cm long
Q94: What is the resistance of a cylindrical
Q96: A rod is 4.0 m long and
Q100: A 120-m long metal wire having a
Unlock this Answer For Free Now!
View this answer and more for free by performing one of the following actions

Scan the QR code to install the App and get 2 free unlocks

Unlock quizzes for free by uploading documents