Which one of the curves shown in the figure best represents the variation of wave speed v as a function of tension for transverse waves on a stretched string? 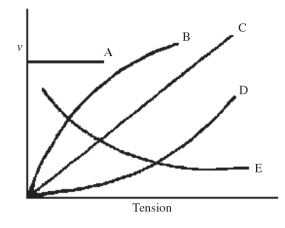
A) A
B) B
C) C
D) D
E) E
Correct Answer:
Verified
Q5: Why does the intensity of waves from
Q11: When a guitar is tuned to adjust
Q12: A string of length L is
Q13: Sound A has a high pitch and
Q16: When a certain string is under
Q25: A string fixed at both ends is
Q28: If a guitar string has a fundamental
Q32: A music tuner uses a 554-Hz C#
Q35: Consider a pipe of length L that
Q38: A stretched string is observed to have
Unlock this Answer For Free Now!
View this answer and more for free by performing one of the following actions

Scan the QR code to install the App and get 2 free unlocks

Unlock quizzes for free by uploading documents