In the graph below, the area between the lines AC and OB to the right of point E represents ________. 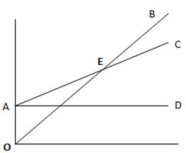
A) fixed costs
B) breakeven point
C) operating loss
D) operating income
Correct Answer:
Verified
Q105: Sensitivity analysis allows managers to see how
Q112: Khayyam Company, which sells tents, has
Q114: Hughes Company manufactures harmonicas which it sells
Q118: Explain the meaning of the operating loss
Q118: Leonardo was a professional classical guitarist
Q119: Zander Company has fixed costs of $14,000.The
Q119: Ajax was a professional classical guitarist
Q120: From the graph given below, identify the
Q129: When the variable cost per unit increases,the
Q135: Complete the statement,using the following terms: increase,decrease,or
Unlock this Answer For Free Now!
View this answer and more for free by performing one of the following actions

Scan the QR code to install the App and get 2 free unlocks

Unlock quizzes for free by uploading documents