Multiple Choice
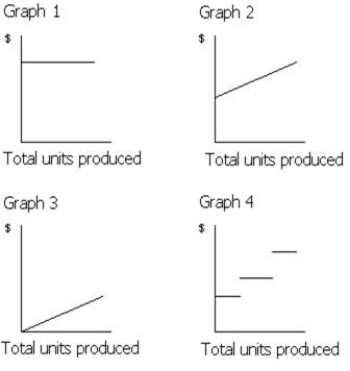
-Which of the graphs in Figure 21-1 illustrates the nature of a mixed cost?
A) Graph 2
B) Graph 3
C) Graph 4
D) Graph 1
Correct Answer:
Verified
Related Questions
Q70: Costs that vary in total in direct
Q71: Which of the following describes the behavior
Q72: Which of the following activity bases would
Q73: Which of the following costs is a
Q74: For purposes of analysis, mixed costs are
A)
Q76: Which of the following costs is an
Q77: Which of the following activity bases would
Unlock this Answer For Free Now!
View this answer and more for free by performing one of the following actions

Scan the QR code to install the App and get 2 free unlocks

Unlock quizzes for free by uploading documents