The following figure shows the effect of a price ceiling in the market for yams.The market was initially in equilibrium at price P2 and quantity B. 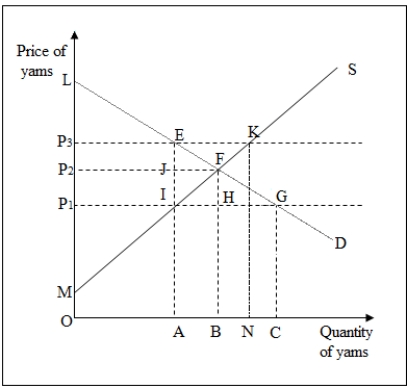 Refer to Figure 10-1.The total surplus at the initial point of equilibrium,F,is given by _____.
A) LFP2
B) LFGP1
C) LFM
D) LFIP1
Correct Answer:
Verified
Q1: The total surplus gained by all the
Q2: When a price ceiling is imposed in
Q3: Use the following figure to answer the
Q5: What is meant by a deadweight loss?
A)It
Q6: Suppose the demand for raspberry frozen yogurt
Q7: The level of output produced by a
Q8: Use the following figure to answer the
Q9: The long-run supply curve in a constant-cost
Q10: Suppose the demand for ice cream sundaes
Q11: Suppose an increasing-cost competitive industry is in
Unlock this Answer For Free Now!
View this answer and more for free by performing one of the following actions

Scan the QR code to install the App and get 2 free unlocks

Unlock quizzes for free by uploading documents