Use the following figure to answer the question : Figure 18-2 :
shows the demand and supply curves of labor.A per-unit tax imposed on the wage income of the employees shifts the supply curve of labor upward. 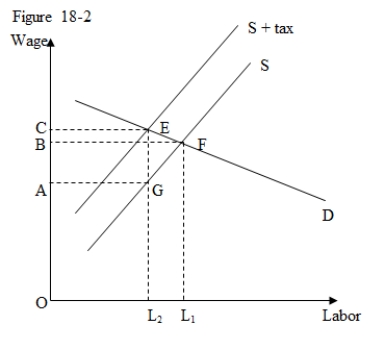
-According to Figure 18-2,the proportion of the per-unit tax paid by employees is:
A) CB/CA.
B) BA/OB.
C) AB/CA.
D) OA/OC.
Correct Answer:
Verified
Q29: An increase in the minimum wage imposed
Q30: Which of the following factors determines the
Q31: Use the following figure to answer the
Q32: Which of the following is true regarding
Q33: Most of a payroll tax is eventually
Q35: Which of the following defines an efficiency
Q36: Use the following figure to answer the
Q37: Empirical evidence suggests that a large majority
Q38: A change in the social security system
Q39: An aggregate labor supply curve is likely
Unlock this Answer For Free Now!
View this answer and more for free by performing one of the following actions

Scan the QR code to install the App and get 2 free unlocks

Unlock quizzes for free by uploading documents