Use the following figure to answer the question : Figure 19-1 :
,the curve TT shows how the allocation of a resource affects the well-being of two individuals,Hank and Monica. 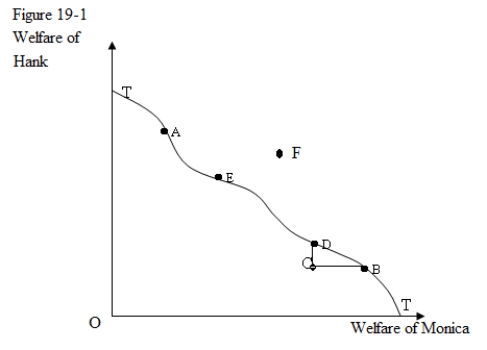
-In Figure 19-1,the curve TT shows:
A) a single and unique distribution of resources that jointly maximizes Hank's and Monica's well-being.
B) all the efficient resource allocations that are attainable.
C) all the points where the marginal rates of substitution between goods are equal for both Hank and Monica.
D) all the points that maximize the individual well-being of Hank and Monica.
Correct Answer:
Verified
Q19: General equilibrium analysis is the study of:
A)how
Q20: Assuming that Good X and Good Y
Q21: Which of the following statements about the
Q22: Use the following figure to answer the
Q23: Use the following figure to answer the
Q25: A comparison between the resource allocation at
Q26: Which of the following is true of
Q27: Which of the following is not one
Q28: Any two goods are said to be
Q29: An exchange of goods between two individuals,Frank
Unlock this Answer For Free Now!
View this answer and more for free by performing one of the following actions

Scan the QR code to install the App and get 2 free unlocks

Unlock quizzes for free by uploading documents