Use the following figure to answer the question : Figure 19-1 :
,the curve TT shows how the allocation of a resource affects the well-being of two individuals,Hank and Monica. 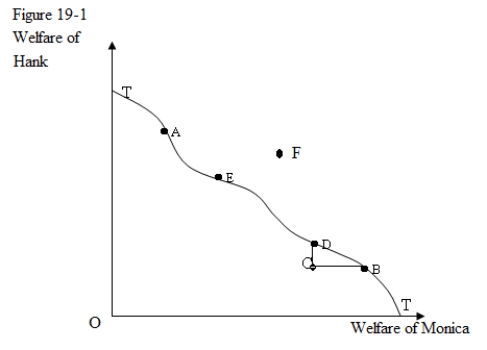
-In Figure 19-1,point C:
A) represents the resource allocation where total welfare is minimized.
B) indicates an inefficient allocation of resources.
C) is Pareto optimal.
D) represents an efficient but undesirable allocation of resources.
Correct Answer:
Verified
Q33: If the marginal rate of substitution between
Q34: Assume that Jeff and Jane both consume
Q35: Which of the following is true of
Q36: An Edgeworth production box:
A)identifies the most efficient
Q37: The _ identifies the different distributions of
Q39: In Figure 19-2 given below, points A,
Q40: Assume that Bill and Terry consume two
Q41: Suppose an economy produces two goods,corn and
Q42: A point on the production possibility frontier
Q43: A perfectly competitive economy generally results in
Unlock this Answer For Free Now!
View this answer and more for free by performing one of the following actions

Scan the QR code to install the App and get 2 free unlocks

Unlock quizzes for free by uploading documents