Use the following figure to answer the question : Figure 20-1 : D1 and S1 are the private demand and supply curves,of a commodity produced by a competitive firm.S2 reflects the social marginal cost of production,while S0 represents the external marginal cost. 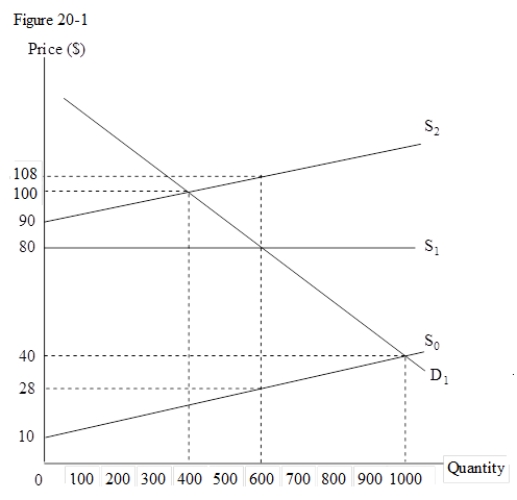
-From Figure 20-1,we can infer that the efficient output is:
A) 900 units.
B) 500 units.
C) 400 units.
D) 600 units.
Correct Answer:
Verified
Q53: Which of the following activities is most
Q54: The social cost of producing a commodity
Q55: Which of the following is true of
Q56: What would happen if the government tries
Q57: Which of the following is a point
Q59: Which of the following activities entails an
Q60: A firm produces a product valued by
Q61: Use the following figure to answer the
Q62: Use the following figure to answer the
Q63: Use the following figure to answer the
Unlock this Answer For Free Now!
View this answer and more for free by performing one of the following actions

Scan the QR code to install the App and get 2 free unlocks

Unlock quizzes for free by uploading documents