Use the following figure to answer the question : Figure 20-2 : shows the competitive supply curve of a commodity is given by S1,the private marginal benefit curve is D1,the marginal social benefit curve is D2,and the MBE curve reflects the marginal external benefits. 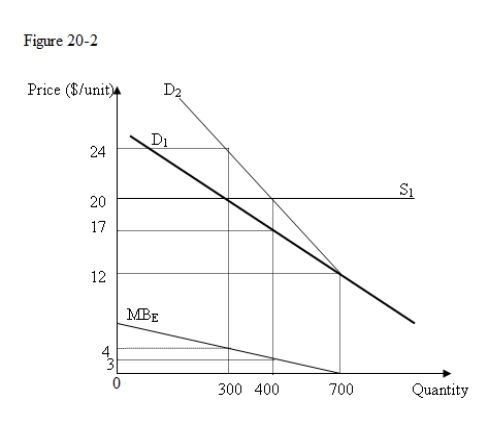
-In Figure 20-2,the price level when the efficient output is being produced is _____ than the price level when the market equilibrium output is being produced by _____.
A) less;$8
B) more;$4
C) less;$3
D) more;$3
Correct Answer:
Verified
Q74: Use the following figure to answer the
Q75: Use the following figure to answer the
Q76: Use the following figure to answer the
Q77: Externalities mainly arise because:
A)consumers have more market
Q78: Use the following figure to answer the
Q80: Use the following figure to answer the
Q81: A uniform per-unit tax on pollution achieves
Q82: Which of the following pollution abatement policies
Q83: Perfect competition ensures efficiency in industry output
Q84: The Red List of Threatened Species,compiled by
Unlock this Answer For Free Now!
View this answer and more for free by performing one of the following actions

Scan the QR code to install the App and get 2 free unlocks

Unlock quizzes for free by uploading documents