Use the following figure to answer the question : Figure 20-2 : shows the competitive supply curve of a commodity is given by S1,the private marginal benefit curve is D1,the marginal social benefit curve is D2,and the MBE curve reflects the marginal external benefits. 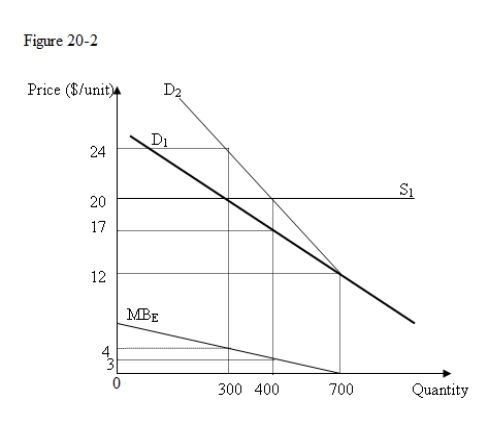
-From Figure 20-2,we can conclude that to help the market attain the efficient level of output,the government should:
A) provide a subsidy of $8 per unit to the producer.
B) impose a tax of $4 per unit of production.
C) provide a subsidy of $3 per unit to the producer.
D) impose a tax of $3 per unit of production.
Correct Answer:
Verified
Q66: The marginal social cost and marginal private
Q67: Reducing automobile pollution beyond a certain point
Q68: A tax used to internalize an external
Q69: If the production of a certain commodity
Q70: Use the following figure to answer the
Q72: All of the following statements are true
Q73: Use the following figure to answer the
Q74: Use the following figure to answer the
Q75: Use the following figure to answer the
Q76: Use the following figure to answer the
Unlock this Answer For Free Now!
View this answer and more for free by performing one of the following actions

Scan the QR code to install the App and get 2 free unlocks

Unlock quizzes for free by uploading documents