? 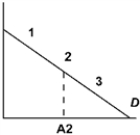 ?In the picture above the point A2 is half way between the origin and the quantity intercept of the demand curve. The price elasticity at point "3" is
A) 0
B) between -? and -1
C) -1
D) between -1 and 0
Correct Answer:
Verified
Q20: With only two goods,if the income effect
Q21: If good X is a normal good
Q22: An increase in quantity demanded is represented
Q23: If income doubles and the quantity demanded
Q24: Consider the two statements: Which of the
Q26: If an individual buys only two goods
Q27: An individual's demand curve
A)represents the various quantities
Q28: Suppose demand can be written as
Q29: Suppose demand can be written as
Q30: A decrease in demand is represented by
A)a
Unlock this Answer For Free Now!
View this answer and more for free by performing one of the following actions

Scan the QR code to install the App and get 2 free unlocks

Unlock quizzes for free by uploading documents