In the graph below,the area between the lines AC and OB to the right of point E represents ________. 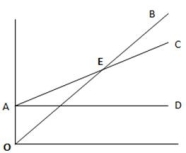
A) fixed costs
B) breakeven point
C) operating loss
D) operating income
Correct Answer:
Verified
Q107: Brad was a professional classical guitar
Q109: Sensitivity analysis empowers managers with better information
Q110: Luca was a professional classical guitar
Q113: From the graph given below,identify the fixed
Q121: _ is a "what if" technique that
Q123: An increase in sales price per unit
Q124: When the sales price per unit decreases,the
Q126: When the sales price per unit decreases,the
Q129: When the variable cost per unit increases,the
Q139: Complete the statement,using the following terms: increase,decrease,or
Unlock this Answer For Free Now!
View this answer and more for free by performing one of the following actions

Scan the QR code to install the App and get 2 free unlocks

Unlock quizzes for free by uploading documents