The following diagram is a cost-volume-profit graph for a manufacturing company: Select the answer that best describes the labeled item on the diagram.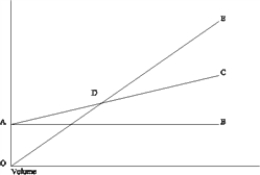
A) Area CDE represents the area of net loss.
B) Line AC graphs total fixed costs.
C) Point D represents the point at which the contribution margin per unit increases.
D) Line AC graphs total costs.
Correct Answer:
Verified
Q18: Product 1 has a contribution margin of
Q25: Using cost-volume-profit analysis, we can conclude that
Q28: Which of the following assumptions does NOT
Q33: Assuming all other things are the same,
Q37: Assume the following cost behaviour data for
Q38: Assuming all other things are the same,
Q39: In 2004, Angel's Bath and Body Shop
Q40: Lewis Production Company had the following projected
Q46: The following diagram is a cost-volume-profit graph
Q47: The income statement for Thomas Manufacturing Company
Unlock this Answer For Free Now!
View this answer and more for free by performing one of the following actions

Scan the QR code to install the App and get 2 free unlocks

Unlock quizzes for free by uploading documents