Figure 5-2 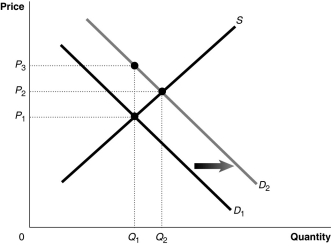 Figure 5-2 shows a market with an externality.The current market equilibrium output of Q1 is not the economically efficient output.The economically efficient output is Q2.
-Refer to Figure 5-2.Suppose the current market equilibrium output of Q1 is not the economically efficient output because of an externality.The economically efficient output is Q2.In that case,diagram shows
A) the effect of a subsidy granted to producers of a good.
B) the effect of an excess demand in a market.
C) the effect of a positive externality in the consumption of a good.
D) the effect of a negative externality in the consumption of a good.
Correct Answer:
Verified
Q34: Figure 5-3 Q35: Figure 5-3 Q37: Figure 5-2 Q40: Figure 5-3 Q54: Assume that emissions from electric utilities contribute Q63: An externality is an example of a Q71: Article Summary Q90: When negative externalities exist, the competitive market Q115: According to Steven Cheung: "Pollination contracts usually Q120: Assume that air pollution from a copper Unlock this Answer For Free Now! View this answer and more for free by performing one of the following actions Scan the QR code to install the App and get 2 free unlocks Unlock quizzes for free by uploading documents![]()
![]()
![]()
![]()
According to a study by the

