Figure 2-8
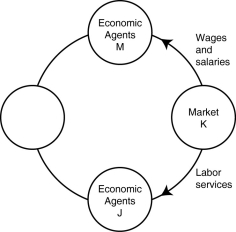
-Refer to Figure 2-8. In the circular flow diagram,market K represents
A) households.
B) product markets.
C) firms.
D) factor markets.
Correct Answer:
Verified
Q111: Table 2-6 Q119: Figure 2-8 Q181: The circular flow model demonstrates Q186: Firms Q191: Which of the following is a factor Q192: Households Q194: Which of the following is not a Q196: An example of a factor of production Q198: The resource income earned by those who Q200: In the circular flow model,households
![]()
![]()
A)the role of
A)have no influence on the circular flow
A)purchase final goods and services in the
A)sell goods and
Unlock this Answer For Free Now!
View this answer and more for free by performing one of the following actions

Scan the QR code to install the App and get 2 free unlocks

Unlock quizzes for free by uploading documents