Figure 13-9 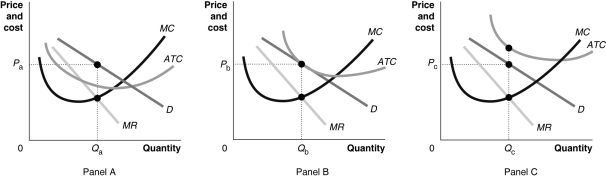
-Refer to Figure 13-9.Which of the graphs in the figure above reflects the decline in sales that Starbucks experienced as a result of increased competition from companies like McDonald's and Dunkin' Donuts.Assume that as a result of the competition,Starbucks began to experience an economic loss.
A) Panel A
B) Panel B
C) Panel C
D) either Panel A or Panel C
Correct Answer:
Verified
Q127: If Starbucks is successful at luring away
Q207: A monopolistic competitor does not earn profits
Q213: In the long-run equilibrium, both the perfectly
Q216: Only one of the following statements is
Q221: To maximize their profits and defend those
Q225: _ describes the actions a firm takes
Q239: Which of the following can a firm
Q243: The most important of the factors that
Q263: Being the first to sell a particular
Q269: In a monopolistically competitive market, a successful
Unlock this Answer For Free Now!
View this answer and more for free by performing one of the following actions

Scan the QR code to install the App and get 2 free unlocks

Unlock quizzes for free by uploading documents