Figure 12-7 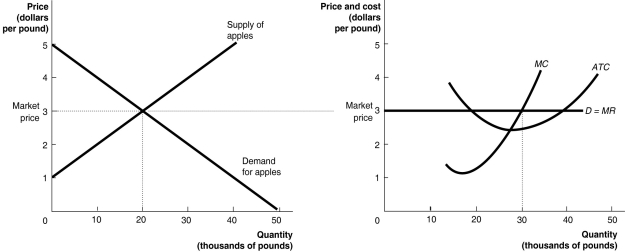 The graphs in Figure 12-7 represent the perfectly competitive market demand and supply curves for the apple industry and demand and cost curves for a typical firm in the industry.
-Refer to Figure 12-7.The graphs depicts a short run equilibrium.How will this differ from the long-run equilibrium? (Assume this is a constant-cost industry.)
A) Fewer firms will be in the market in the long run than in the short run.
B) The price will be higher in the long run than in the short run.
C) The market supply curve will be further to the left in the long run than in the short run.
D) The firm's profit will be lower in the long run than in the short run.
Correct Answer:
Verified
Q130: Figure 12-8 Q201: After an increase in demand in a Q242: If a firm in a perfectly competitive Q252: A firm could continue to operate for Q255: Competition has driven the economic profits in Q265: When firms exit a perfectly competitive industry, Q268: Which of the following does not hold Q276: Why would a company continue to operate Q278: Assume that the personal computer industry is Q287: A perfectly competitive industry achieves allocative efficiency![]()
Unlock this Answer For Free Now!
View this answer and more for free by performing one of the following actions

Scan the QR code to install the App and get 2 free unlocks

Unlock quizzes for free by uploading documents