Figure 11-4 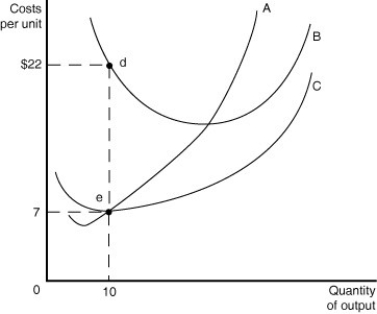
-Refer to Figure 11-4 above to answer the following questions.
a.Identify the curves in the diagram.
A ________________________________________
B ________________________________________
C ________________________________________
b.What is the numerical value of fixed cost when the quantity of output=10?
c.What is the numerical value of variable cost when the quantity of output=10?
d.What is the numerical value of total cost when the quantity of output =10?
e.What is the numerical value of average fixed cost when the quantity of output =10?
f.What is the numerical value of average total cost when the quantity of output =10?
g.On the graph identify the area that represents the total variable cost of production when the quantity of output =10.
h.On the graph identify the area that represents the fixed cost of production when the quantity of output =10.
Correct Answer:
Verified
View Answer
Unlock this answer now
Get Access to more Verified Answers free of charge
Q115: In 1955,the chairman of the Sony corporation
Q201: A firm's short-run average total cost curve
Q208: Use the general relationship between marginal and
Q220: In a diagram showing the average total
Q226: If a firm's long-run average total curve
Q248: A curve showing the lowest cost at
Q250: Minimum efficient scale is defined as the
Q254: If an airport decides to expand by
Q258: The level of output at which all
Q287: A curve that shows all the combinations
Unlock this Answer For Free Now!
View this answer and more for free by performing one of the following actions

Scan the QR code to install the App and get 2 free unlocks

Unlock quizzes for free by uploading documents