Figure 11-6 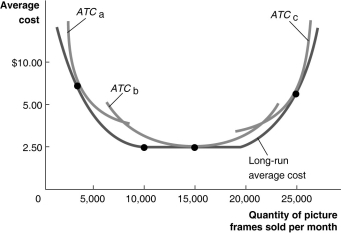 Figure 11-6 illustrates the long-run average cost curve for a firm that produces picture frames.The graph also includes short-run average cost curves for three firm sizes: ATCa,ATCb and ATCc.
-Refer to Figure 11-6.The minimum efficient scale of output is reached at what rate of output?
A) 10,000 workers
B) 5,000 picture frames
C) 20,000 picture frames
D) 10,000 picture frames
Correct Answer:
Verified
Q108: In 1955,the chairman of the Sony corporation
Q115: In 1955,the chairman of the Sony corporation
Q201: A firm's short-run average total cost curve
Q210: As output increases, the distance between average
Q220: In a diagram showing the average total
Q232: Which of the following statements regarding a
Q248: A curve showing the lowest cost at
Q251: Economies of scale occur when
A)a firm's long-run
Q254: If an airport decides to expand by
Q257: If an airport decides to expand by
Unlock this Answer For Free Now!
View this answer and more for free by performing one of the following actions

Scan the QR code to install the App and get 2 free unlocks

Unlock quizzes for free by uploading documents