Figure 11-6 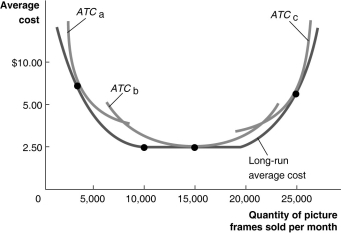 Figure 11-6 illustrates the long-run average cost curve for a firm that produces picture frames.The graph also includes short-run average cost curves for three firm sizes: ATCa,ATCb and ATCc.
-Refer to Figure 11-6.In the short run,if the firm sells fewer than 5,000 picture frames per month
A) it should produce with the scale of operation associated with ATCa.
B) it should produce with the scale of operation associated with ATCb.
C) it should produce with the scale of operation associated with ATCc.
D) it will experience constant returns to scale.
Correct Answer:
Verified
Q125: Table 11-5 Q208: Use the general relationship between marginal and Q226: If a firm's long-run average total curve Q250: Minimum efficient scale is defined as the Q258: The level of output at which all Q265: If a firm is experiencing diseconomies of Q273: Use a long-run average cost curve graph Q280: Minimum efficient scale is defined as the Q284: The rate at which a firm is Q287: A curve that shows all the combinations
![]()
Unlock this Answer For Free Now!
View this answer and more for free by performing one of the following actions

Scan the QR code to install the App and get 2 free unlocks

Unlock quizzes for free by uploading documents