Figure 11-6 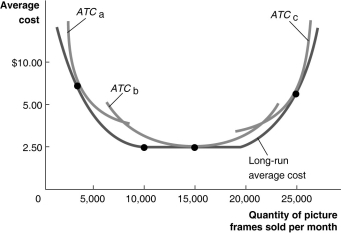 Figure 11-6 illustrates the long-run average cost curve for a firm that produces picture frames.The graph also includes short-run average cost curves for three firm sizes: ATCa,ATCb and ATCc.
-Refer to Figure 11-6.If the firm chooses to produce and sell 25,000 frames per month by operating in the short run with a scale operation represented by ATCc
A) the firm will not be operating efficiently.
B) the firm will be operating efficiently.
C) the firm would lower its average costs by reducing its scale of operation.
D) the firm will not be able to earn a profit.
Correct Answer:
Verified
Q135: Figure 11-6 Q136: Table 11-5 Q143: Figure 11-9 Q144: Figure 11-9 Q249: The River Rouge plant was built by Q252: Assume that you observe the long-run average Q268: A U-shaped long-run average cost curve implies Q279: State the law of diminishing returns.How do Q301: Consider a firm that uses two inputs, Q317: On an isoquant/isocost graph, the least cost Unlock this Answer For Free Now! View this answer and more for free by performing one of the following actions Scan the QR code to install the App and get 2 free unlocks Unlock quizzes for free by uploading documents![]()
![]()
![]()
![]()

