Figure 11-7 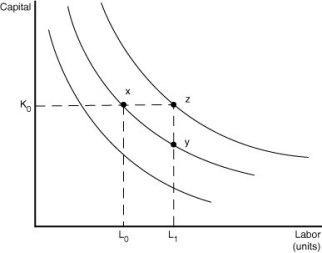
-Refer to Figure 11-7.The figure above illustrates a series of isoquants.Which of the following statements is true?
A) Points x,z,and y all represent the same output.
B) Points z and y represent the same output; this output is produced with more capital at z than at y.
C) Point x and y represent the same output but the cost of production at y is greater than the cost of production at x.
D) Point z represents a greater output than point x or point y.
Correct Answer:
Verified
Q161: Use the following graph to answer the
Q294: The typical shape of an isoquant is
A)convex
Q304: The slope of an isocost line _
Q314: Suppose a firm uses labor and capital
Q315: Economists Cade Massey and Richard Thaler analyzed
Q317: An isocost line shows
A)combinations of two inputs
Q318: Suppose two countries use different combinations of
Q322: Firms in different countries that face different
Q323: What is an isocost line? What is
Q324: The slope of an isoquant is equal
Unlock this Answer For Free Now!
View this answer and more for free by performing one of the following actions

Scan the QR code to install the App and get 2 free unlocks

Unlock quizzes for free by uploading documents