Multiple Choice
Table 9-7
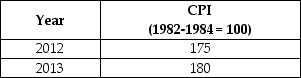
-Refer to Table 9-7.Suppose that the data in the table above reflect price levels in the economy.What is the inflation rate between 2012 and 2013?
A) 2.9%
B) 3.5%
C) 4.6%
D) 5%
E) 7.5%
Correct Answer:
Verified
Related Questions
Q147: The percent increase in the CPI from
Q151: Table 9-6 Q159: The average price of goods and services
![]()
Unlock this Answer For Free Now!
View this answer and more for free by performing one of the following actions

Scan the QR code to install the App and get 2 free unlocks

Unlock quizzes for free by uploading documents