Multiple Choice
Table 9-19
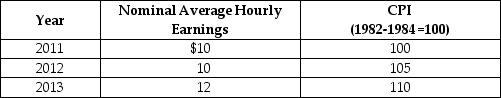
-Refer to Table 9-19.Looking at the table above,what is the rate of growth of the average price level from 2011 to 2012?
A) 1%
B) 2%
C) 3%
D) 4%
E) 5%
Correct Answer:
Verified
Related Questions
Q182: Why does the substitution bias cause the
Q193: The producer price index tracks the prices

