Figure 19-1 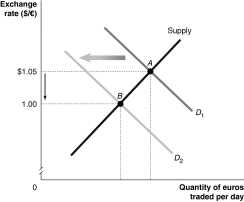
-Refer to Figure 19-1.Which of the following would cause the change depicted in the figure above?
A) U.S.productivity falls relative to European productivity.
B) Americans increase their preferences for goods produced in the EU relative to American goods.
C) The European Union increases its quotas on Italian wine.
D) The price level of goods produced in the EU decreases relative to the price level of goods produced in the United States.
Correct Answer:
Verified
Q61: Countries that use the euro as their
Q62: If relative purchasing power between the United
Q64: If the average productivity of American firms
Q65: A Big Mac costs $4.00 in the
Q70: The "Big Mac Theory of Exchange Rates"
Q71: Suppose the GDP deflator in the United
Q73: If,at the current exchange rate between the
Unlock this Answer For Free Now!
View this answer and more for free by performing one of the following actions

Scan the QR code to install the App and get 2 free unlocks

Unlock quizzes for free by uploading documents