Figure 15-3 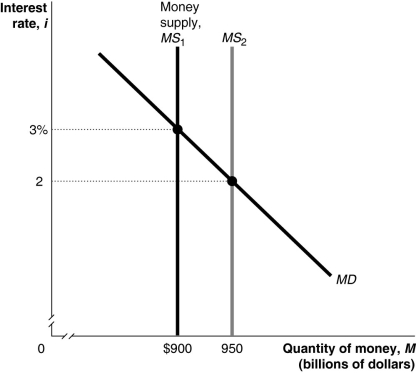
-Refer to Figure 15-3.In the figure above,when the money supply shifts from MS1 to MS2,at the interest rate of 3 percent households and firms will
A) buy Treasury bills.
B) sell Treasury bills.
C) neither buy nor sell Treasury bills.
D) want to hold more money.
Correct Answer:
Verified
Q48: The money demand curve has a negative
Q49: Increases in the price level
A)increase the opportunity
Q50: When the price of a financial asset
Q51: An increase in real GDP
A)increases the buying
Q52: For purposes of monetary policy,the Federal Reserve
Q54: If the Fed raises the interest rate,this
Q55: The money supply curve is vertical if
A)banks
Q56: The Fed's two main monetary policy targets
Q57: An increase in the demand for Treasury
Q58: Suppose the Fed increases the money supply.Which
Unlock this Answer For Free Now!
View this answer and more for free by performing one of the following actions

Scan the QR code to install the App and get 2 free unlocks

Unlock quizzes for free by uploading documents