Table 11-3
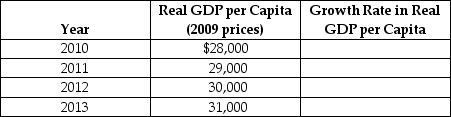
-Refer to Table 11-3.Use the table above to calculate the annual growth rate in GDP.Also calculate the total percentage change in the growth from 2010 through 2013.Explain the difference between the average annual growth rate in real per capita GDP from 2010 through 2013 and the total percentage change in growth from 2010 and 2013.
Correct Answer:
Verified
View Answer
Unlock this answer now
Get Access to more Verified Answers free of charge
Q111: According to the text,there are three ways
Q121: One of the results of Paul Romer's
Q125: Technological change allows the economy to produce
Q130: The Soviet Union's economic growth rate slowed
Q136: Starting at point B in the diagram
Q141: Some economists argue that the productivity slowdown
Q143: In the United States,the annual growth rate
Q144: Some economists argue that the productivity slowdown
Q145: Which of the following is true regarding
Q157: Because of the productivity slowdown in the
Unlock this Answer For Free Now!
View this answer and more for free by performing one of the following actions

Scan the QR code to install the App and get 2 free unlocks

Unlock quizzes for free by uploading documents